Local council · Northern District
Daburiyya by the numbers
Daburiyya has 11,148 residents (CBS estimate, September 2026). Compared with the 188 other towns of a similar size, it has fewer renters than 94% of them and more crime than 93% of them.
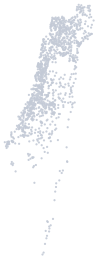
How does Daburiyya compare with other towns?
Daburiyya Another of the 189 towns with 2,000 to 20,000 residents
ShowHide
How does Daburiyya compare with other towns?
Daburiyya Another of the 189 towns with 2,000 to 20,000 residents
Do people rent or own?
How much crime?
How much do people earn?
Can you live without a car?
3 more comparisonsLess
How educated?
Big families?
Young or old?
Sources: wages: National Insurance 2025; age: National Insurance 2026; crime: Israel Police 2025; education, renting, cars and household size: the 2022 census, the only source at town level. Compared with the 189 towns with 2,000 to 20,000 residents.
Housing and construction
Building plans and urban renewal in Daburiyya
1,050 housing units in approved plans · 6 land tenders since 2015
All the data →What is the average salary in Daburiyya?
₪10,615 a month for the average employee, 30% lower than the national average; socio-economic cluster 4 of 10
Wages 2025
ShowHide
What is the average salary in Daburiyya?
₪10,615 a month for the average employee, 30% lower than the national average; socio-economic cluster 4 of 10
Wages 2025
30% below the national average.
Ranked 91 of 255 local authorities (1 is the lowest).
Wages: National Insurance Institute, 2025. Cluster: CBS socio-economic index 2021, the latest (published in 2024).
Schools and kindergartens in Daburiyya
5 schools, 19 kindergartens and 8 daycare centres
ShowHide
Schools and kindergartens in Daburiyya
5 schools, 19 kindergartens and 8 daycare centres
Schools by stream: State (secular) 5.
Source: Ministry of Education, list of active institutions
Parks, transport and health care in Daburiyya
8 sports facilities
ShowHide
Parks, transport and health care in Daburiyya
8 sports facilities
Crime in Daburiyya: is Daburiyya safe?
57 cases per 1,000 residents, above the national average (33.9)
Israel Police · 2025
ShowHide
Crime in Daburiyya: is Daburiyya safe?
57 cases per 1,000 residents, above the national average (33.9)
Israel Police · 2025
Nationwide: 33.9. Up 5% from 2024. Violent offences are 15% of cases, against 16% nationwide.
Source: Israel Police, cases opened in 2025 (629 cases).
Who lives in Daburiyya?
8% are 65 or older (less than the national share); the largest health fund is Clalit
As of October 2026
ShowHide
Who lives in Daburiyya?
8% are 65 or older (less than the national share); the largest health fund is Clalit
As of October 2026
Age groups
Under 18Working age (18–65)65+
Health funds (kupot holim)
ClalitMaccabiMeuhedetLeumit
Source: National Insurance Institute, statistics by town (ages as of October 2026). Benefit rates are shares of all residents.
How does Daburiyya vote?
Largest list: Joint List (73%). Turnout 82%
Election for the 26th Knesset
ShowHide
How does Daburiyya vote?
Largest list: Joint List (73%). Turnout 82%
Election for the 26th Knesset
In the 2026 election, Daburiyya voted Joint List more than the country as a whole (+64 points) and Likud less (-20).
In 2022 the largest list here was Hadash-Ta'al (35%).
Daburiyya All Israel
Source: Central Elections Committee, 26th Knesset election (2026), via the Kaplan Open Source mirror (official results by locality). Compared with the 25th Knesset (2022)
How much is arnona (property tax) in Daburiyya?
About ₪289 a month for a 90 m² apartment, less than most local authorities
Audited accounts 2024
ShowHide
How much is arnona (property tax) in Daburiyya?
About ₪289 a month for a 90 m² apartment, less than most local authorities
Audited accounts 2024
A 90 m² apartment in Davoria pays about ₪289 a month in arnona on average (₪3,465 a year).
Of every shekel the authority spends, 53 agorot go to education and 11 agorot to welfare. The authority ended 2024 with a deficit of ₪1,120 thousand.
Source: Ministry of the Interior, audited financial reports of local authorities for 2024. Actual arnona depends on the zone and type of property.
Towns like Daburiyya, and nearby
Most similar: Beit Jann, Abu Sinan, Tur'an
ShowHide
Towns like Daburiyya, and nearby
Most similar: Beit Jann, Abu Sinan, Tur'an
Similar in wages, education, age, renting, car ownership, household size and population mix.
Closest on the map
- Shibli-Umm Al-Ghanam2.9 km
- Kadoorie3.5 km
- Beit Keshet3.7 km
- Ein Mahel3.8 km
- Iksal4.5 km
- Kfar Tavor4.6 km
Daburiyya: common questions
ShowHide
Daburiyya: common questions
What is the population of Daburiyya?
Daburiyya has 11,148 residents, according to the CBS estimate for September 2026.
Is Daburiyya safe?
In 2025, police opened 57 criminal cases per 1,000 residents in Daburiyya, above the national average (33.9).
How many schools are there in Daburiyya?
Daburiyya has 5 schools, 19 kindergartens and 8 daycare centres, according to the Ministry of Education.
What is the average salary in Daburiyya?
The average monthly wage per employee in Daburiyya is ₪10,615, against ₪15,140 nationwide (National Insurance, 2025).
Which district is Daburiyya in?
Daburiyya is in the Northern District, Jezreel subdistrict.
Data sources
- Provisional population estimates by locality, Central Bureau of Statistics (CBS)
- Localities file 2024, Central Bureau of Statistics (CBS)
- Residents aged 65+ in localities of 5,000+, 2024, Central Bureau of Statistics (CBS)
- 2022 Census: selected data by locality (latest census), Central Bureau of Statistics (CBS) · updated June 2024
- Crime data 2025, Israel Police · updated April 2026
- 26th Knesset election results (October 2026) by locality, via the Kaplan Open Source mirror, Central Elections Committee
- 25th Knesset election results (2022) by locality, Central Elections Committee · updated September 2024
- Sale prices and rents by locality (Nadlan), Israel Tax Authority
- Statistics by locality: wages, ages, health funds and benefits, National Insurance Institute (Bituach Leumi)
- Localities eligible for income-tax benefits, 2026, Israel Tax Authority · updated January 2026
- Socio-economic index 2021 of authorities and localities (published 2024, the latest), Central Bureau of Statistics (CBS)
- Audited financial reports of local authorities, 2024, Ministry of Interior
- Educational institutions, Ministry of Education · updated October 2026
- Public transport stops, Ministry of Transport · updated October 2026
CBS locality code: 489